For my first High Intelligence blog posting, I’m going to focus on some data found in the WSLCB Traceability database that I’ve used to estimate the level of retail markup across the State. My thanks to David Busby of WeedTraQR for helping me to correctly extract the underlying data (David’s a good guy, and very talented. He’s also based locally and provides great customer service – unlike some other traceability vendors. Go WeedTraQR! … Go Hawks!)
As you may know, I’ve been banging my head against the WSLCB Traceability database for the better part of 7 months and have only had limited success in getting the data it apparently contains into a form where useful analytic work could be done.
Will and the Cannabis Transparency Project team that Dr. Corva put together initially whetted my analytic appetite by cracking the lab test result data into a form that allowed comparison across the labs. In the meantime, my efforts to create a useful form of sales- data out of the database have been consistently frustrated. Shortly after a brief meeting with David & Eric from WeedTraQR, an elegant piece of SQL came my way that ended that frustration. Thank-you, David!
What follows is a brief summary of some work I’ve done using Busby-enabled-data from the first 12 months of the market (through July 31, 2015) showing the variability of retail markups across the State.
Let me start with defining “Markup”. There seems to be a good deal of confusion over what one means when one says “markup”.
What I mean in this blog (and generally) when I say “markup” is the following:
Markup = (Retail Price – Wholesale Price) / (Wholesale Price) … (ignoring all taxes)
(and 1 + Markup = the retail sales “multiplier”)
In English, if a store buys a gram for $4.33 and sells it for $10.00, that would be considered to be a markup of 1.31 (or 131%). This means that the retail store is selling the product for 2.31 TIMES what they paid for the product at wholesale (or their pre-tax “gain” is 1.31 times the amount they paid for the product). This “gain” ignores all taxes and all of the other costs of doing business such as lease, utilities, wages, etc.
I use this example because, across all stores and across all counties for the entire time period through July 31 of this year (the first 12 full months of the I-502 market), this is the actual overall State-wide markup that occurred. The average Retailer across that time, on average, charged $10.00 (pre-tax) to the customer for every $4.33 they paid to their processor(s).
This is across all product types (flower, extracts for inhalation, solid & liquid medibles and topicals) and just does a brute-force totaling of all wholesale purchases by retail and all retail sales by retail. It does not take into account different product turnover times across stores or product lines or, really, any of the many relevant factors. It is just a brute-force overall calculation.
What is interesting here is that, with the average Retail markup at 131%, it is not uncommon to see overall markup levels in excess of 200% at the individual store level. On the other hand, there are quite a few stores that have overall markups of less than 100% (e.g., the processor is grossing more from the product than the retailer is, when you subtract their cost for the product).
At the county level, there are 6 counties with average markups over 150%, while there are 7 with average markups that are below 100%. The following map displays markups summarized at the county level (red being high markups, and green being low markups).
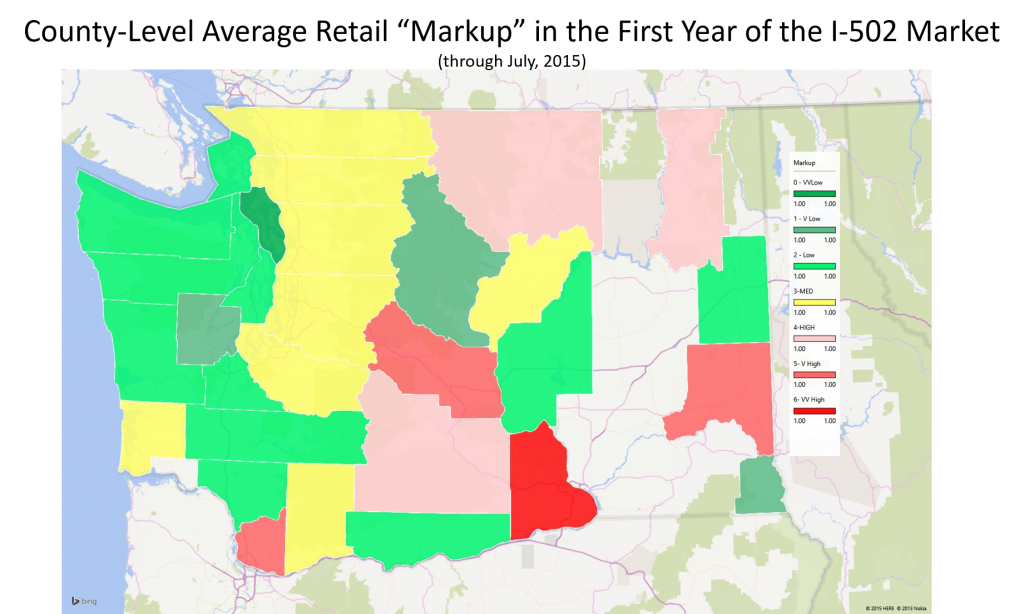
I’ll let the interested reader peruse this for deeper insight, and I welcome any thoughts you wish to share.
I will, however, comment that is nice to see that it seems to be, differentially, Oregonians, Idahoers, and British Columbians that have been supporting the higher-than-average retail markups in our fair State. Our islanders and rain-forest dwellers also appear to be getting some very good deals from their local retailers.
I’ll also comment on the swatch of “no retail data” that exists in the Eastern third of the State. For areas that grow as much State-legal Cannabis as those counties are growing, it seems rather odd that they don’t have a single functioning retail store 13 months after the market opened.
I’d appreciate hearing what you think about this … and hope you’ll stop back this Friday, when I expect to post a chart that shows INDIVIDUAL STORE-LEVEL markup data. The variability across stores is amazing (as it is across product types).
I’ll try to respond to comments promptly (if I can get them working, that is).
Jim
fascinating Jim. Our MMJ survey work has returned very little in the least population-dense counties, and preliminary conclusions include the hypothesis that I502 retail stores in those areas might increase access for medical patients (whereas geographic access is headed south everywhere else).
Interesting.
When I look at the locations of stores showing large markups, I see a tendency for such numbers to be associated with areas that are, otherwise, relatively under-served by the I-502 market (e.g., if you are the only store for 50 miles, CUSTOMER BEWARE) … or serving those poor citizens of backward locales (re: State/Provincial Legalization) such as Oregon, Idaho and British Columbia.
That is entering into my search for good retail properties.
Perhaps value is, truly, relative.
Really interesting data, would there be any way to dig down to the producer level and see what kind of margins they’re getting in the wholesale market.
Tyler … sorry about my tardy reply. WordPress’s “Spam filter” somehow filtered you out … and I did not even know it was trying to keep me safe from the likes of you (just to be safe, I’ve got condoms on my fingers as I type this response).
I’m definitely looking at producer (and processor) data. However, I have no transparency (yet) into the costs of doing business for any of these operations, so I cannot really get “margins” or “profitability” estimates that I’d be comfortable enough with to share publicly.
I could do this for processors that buy from non-linked producers and do “toll processing” on the plant material, but I’ve decided not to at the moment, as any learnings that I take away from such work would be of limited future relevance, given how the LCB has opened up processing license applications to any stand-alone I-502 farmers that want one.
Given that, I believe that I will likely sell more of my services if I focus on the opportunities in the retail segment of the industry. I chose to initially look at Retail markups as this information likely holds some use to the wholesalers of the industry that sell into retail.
One of my clients (and another P/P that I consider a friend) have expressed interests in serving as “toll processors”, so I may do something in that space before the end of the year.
Greetings! I’ve been reading your website for a while now and finally got the bravery to go ahead and give you a shout out from
Houston Tx! Just wanted to say keep up the excellent work!
Thank-you, Houston. I’m glad that you find value in what I’m doing.
I’m sorry that great Nation of Texas would put you away for a long time for doing what we Nor-Westerners are increasingly taking for granted as a right. Change will come. The people I’ve known from Texas have, if nothing else, common sense.
I miss Texas … used to love the people and the attitude and the ‘Q.